分析查询性能
在本页面
The cursor.explain("executionStats") and the db.collection.explain("executionStats") methods provide statistics about the performance of a query. These statistics can be useful in measuring if and how a query uses an index.
db.collection.explain() provides information on the execution of other operations, such as db.collection.update(). See db.collection.explain() for details.
MongoDB Compass provides an Explain Plan tab, which displays statistics about the performance of a query. These statistics can be useful in measuring if and how a query uses an index.
评估查询的性能
考虑包含以下文档的集合inventory:
{ "_id" : 1, "item" : "f1", type: "food", quantity: 500 }
{ "_id" : 2, "item" : "f2", type: "food", quantity: 100 }
{ "_id" : 3, "item" : "p1", type: "paper", quantity: 200 }
{ "_id" : 4, "item" : "p2", type: "paper", quantity: 150 }
{ "_id" : 5, "item" : "f3", type: "food", quantity: 300 }
{ "_id" : 6, "item" : "t1", type: "toys", quantity: 500 }
{ "_id" : 7, "item" : "a1", type: "apparel", quantity: 250 }
{ "_id" : 8, "item" : "a2", type: "apparel", quantity: 400 }
{ "_id" : 9, "item" : "t2", type: "toys", quantity: 50 }
{ "_id" : 10, "item" : "f4", type: "food", quantity: 75 }
The documents appear in MongoDB Compass as the following:

没有索引的查询
The following query retrieves documents where the quantity field has a value between 100 and 200 , inclusive:
db.inventory.find( { quantity: { $gte: 100, $lte: 200 } } )
The query returns the following documents:
{ "_id" : 2, "item" : "f2", "type" : "food", "quantity" : 100 }
{ "_id" : 3, "item" : "p1", "type" : "paper", "quantity" : 200 }
{ "_id" : 4, "item" : "p2", "type" : "paper", "quantity" : 150 }
To view the query plan selected, chain the cursor.explain("executionStats") cursor method to the end of the find command:
db.inventory.find(
   { quantity: { $gte: 100, $lte: 200 } }
).explain("executionStats")
explain() returns the following results:
{
   "queryPlanner" : {
         "plannerVersion" : 1,
         ...
         "winningPlan" : {
            "stage" : "COLLSCAN",
            ...
         }
   },
   "executionStats" : {
      "executionSuccess" : true,
      "nReturned" : 3,
      "executionTimeMillis" : 0,
      "totalKeysExamined" : 0,
      "totalDocsExamined" : 10,
      "executionStages" : {
         "stage" : "COLLSCAN",
         ...
      },
      ...
   },
   ...
}
- queryPlanner.winningPlan.stage displays
COLLSCANto indicate a collection scan.
Collection scans indicate that the mongod had to scan the entire collection document by document to identify the results. This is a generally expensive operation and can result in slow queries.
-
executionStats.nReturned displays
3to indicate that the query matches and returns three documents. -
executionStats.totalKeysExamined displays
0to indicate that this is query is not using an index. -
executionStats.totalDocsExamined displays
10to indicate that MongoDB had to scan ten documents (i.e. all documents in the collection) to find the three matching documents.
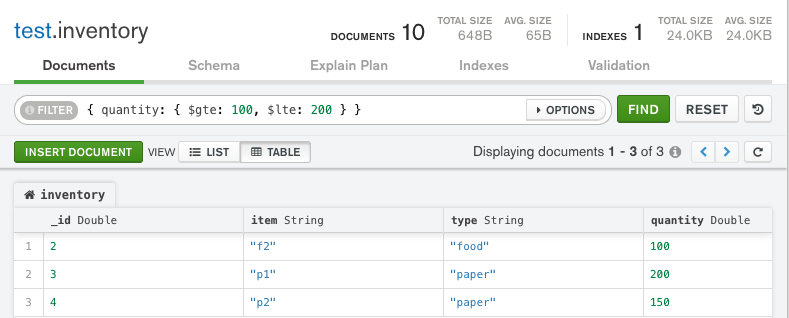
The following query retrieves documents where the quantity field has a value between 100 and 200 , inclusive:
Copy the following filter into the Compass query bar and click Find:
{ quantity: { $gte: 100, $lte: 200 } }
The query returns the following documents:
To view the query plan selected:
-
Click the Explain Plan tab for the
test.inventorycollection. -
Click Explain.
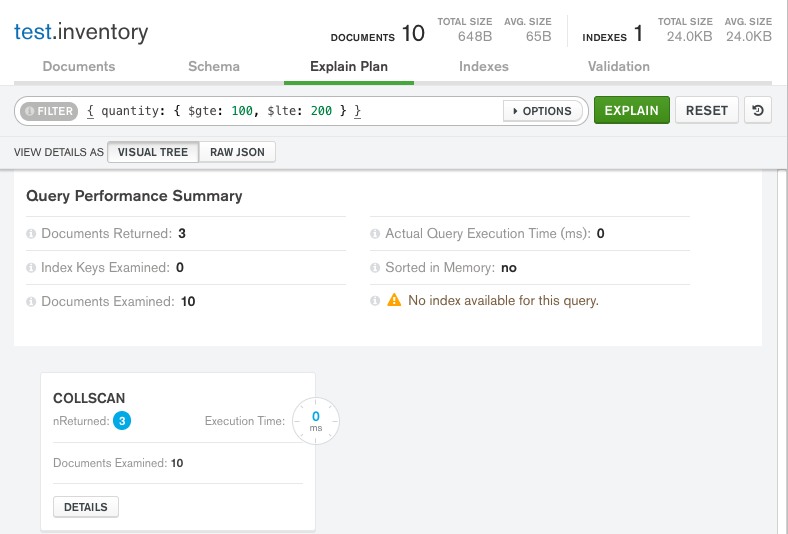
MongoDB Compass displays the query plan as follows:
Note
Because we are working with such a small dataset for the purposes of this tutorial, the Actual Query Execution Time displays 0 seconds, even though we are not using an index.
In a larger dataset, the difference in query execution time between an indexed query versus a non-indexed query would be much more substantial.
Visual Tree
-
The Query Performance Summary shows the execution stats of the query:
-
Documents Returned displays
3to indicate that the query matches and returns three documents.-
Index Keys Examined displays
0to indicate that this query is not using an index. -
Documents Examined displays
10to indicate that MongoDB had to scan ten documents (i.e. all documents in the collection) to find the three matching documents.
-
-
Below the Query Performance Summary, MongoDB Compass displays the
COLLSCANquery stage to indicate that a collection scan was used for this query.
Collection scans indicate that the mongod had to scan the entire collection document by document to identify the results. This is a generally expensive operation and can result in slow queries.
Raw JSON
The explain details can also be viewed in raw JSON format by clicking Raw JSON below the query bar:
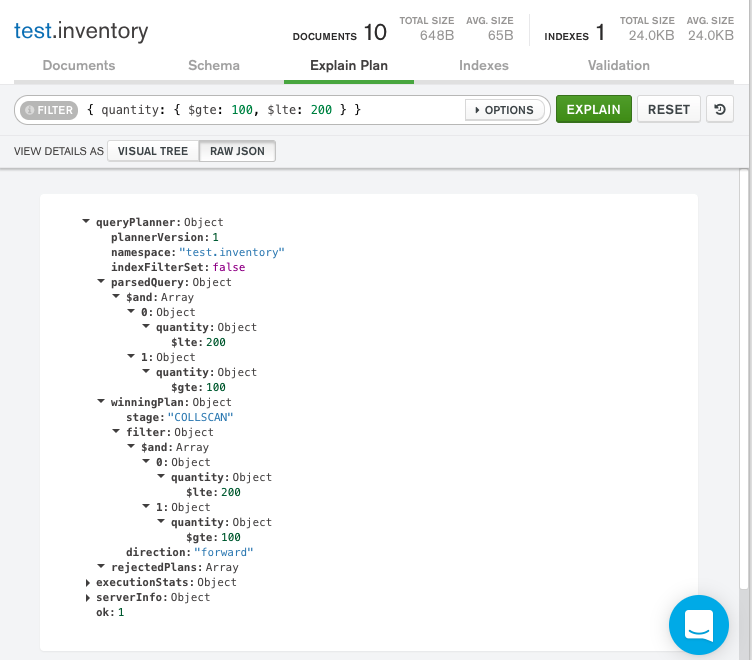
匹配文档的数量与检查的文档的数量之间的差异可能表明,为了提高效率,查询可能会受益于索引的使用。
查询索引
要支持对quantity字段的查询,请在quantity字段上添加索引:
db.inventory.createIndex( { quantity: 1 } )
To view the query plan statistics, use the explain("executionStats") method:
db.inventory.find(
   { quantity: { $gte: 100, $lte: 200 } }
).explain("executionStats")
The explain() method returns the following results:
{
   "queryPlanner" : {
         "plannerVersion" : 1,
         ...
         "winningPlan" : {
               "stage" : "FETCH",
               "inputStage" : {
                  "stage" : "IXSCAN",
                  "keyPattern" : {
                     "quantity" : 1
                  },
                  ...
               }
         },
         "rejectedPlans" : [ ]
   },
   "executionStats" : {
         "executionSuccess" : true,
         "nReturned" : 3,
         "executionTimeMillis" : 0,
         "totalKeysExamined" : 3,
         "totalDocsExamined" : 3,
         "executionStages" : {
            ...
         },
         ...
   },
   ...
}
-
queryPlanner.winningPlan.inputStage.stage displays
IXSCANto indicate index use. -
executionStats.nReturned displays
3to indicate that the query matches and returns three documents. -
executionStats.totalKeysExamined displays
3to indicate that MongoDB scanned three index entries. The number of keys examined match the number of documents returned, meaning that the mongod only had to examine index keys to return the results. The mongod did not have to scan all of the documents, and only the three matching documents had to be pulled into memory. This results in a very efficient query. -
executionStats.totalDocsExamined display
3to indicate that MongoDB scanned three documents.
-
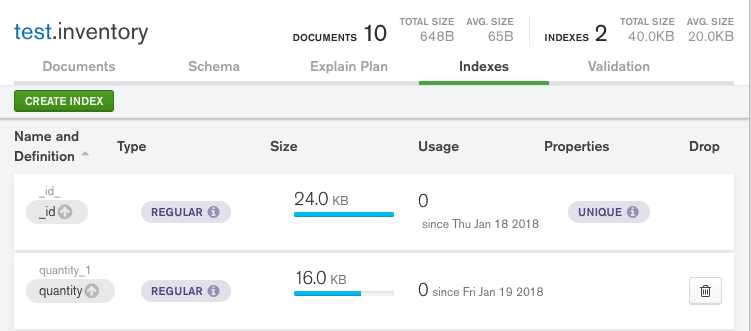
Click the Indexes tab for the
test.inventorycollection. -
Click Create Index.
-
Select
quantityfrom the Select a field name dropdown. -
Select
1 (asc)from the type dropdown. -
Click Create.
Note
Leaving the index name field blank causes MongoDB Compass to create a default name for the index.
You can now see your newly created index in the Indexes tab:
Return to the Explain Plan tab for the inventory collection and re-run the query from the previous step:
{ quantity: { $gte: 100, $lte: 200 } }
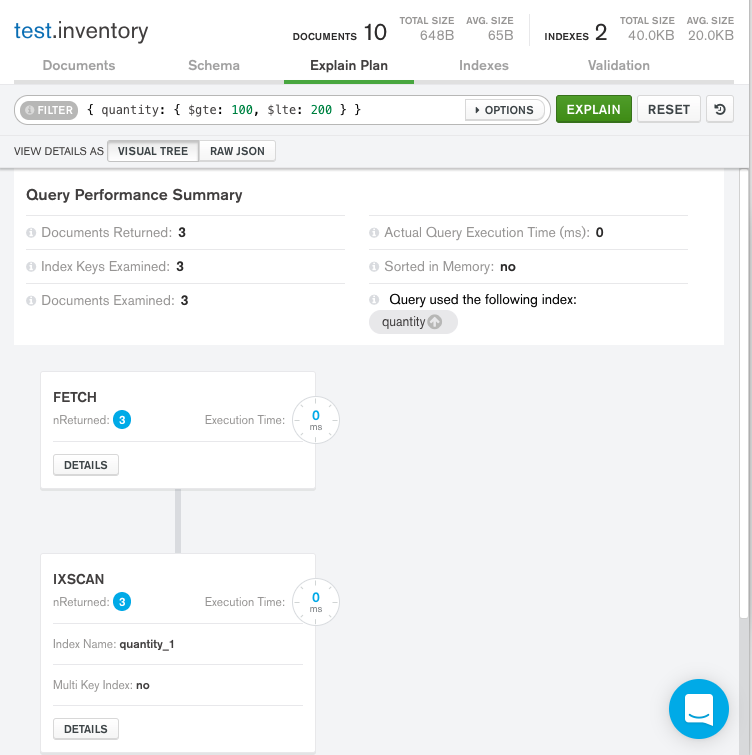
MongoDB Compass displays the query plan as follows:
Visual Tree
-
The Query Performance Summary shows the execution stats of the query:
-
Documents Returned displays
3to indicate that the query matches and returns three documents.-
Index Keys Examined displays
3to indicate that MongoDB scanned three index entries. The number of keys examined match the number of documents returned, meaning that the mongod only had to examine index keys to return the results. The mongod did not have to scan all of the documents, and only the three matching documents had to be pulled into memory. This results in a very efficient query. -
Documents Examined displays
3to indicate that MongoDB scanned three documents. -
On the right-hand side of the Query Performance Summary, MongoDB Compass shows that the query used the
quantityindex.
-
-
Below the Query Performance Summary, MongoDB Compass displays the query stages
FETCHandIXSCAN.IXSCANindicates that the mongod used an index to satisfy the query before exeuting theFETCHstage and retrieving the documents.
Raw JSON
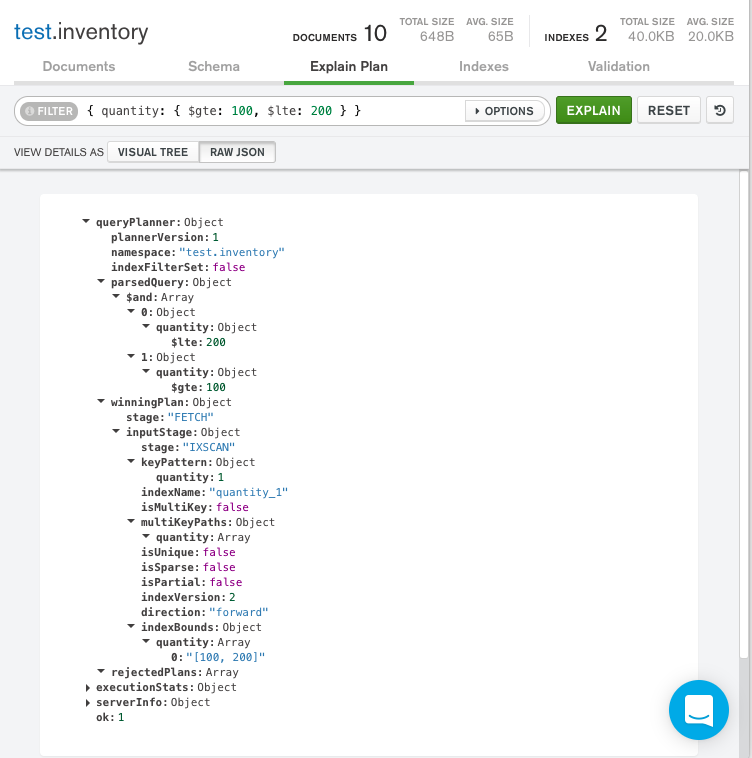
The explain details can also be viewed in raw JSON format by clicking Raw JSON below the query bar:
如果没有索引,查询将扫描10个文档的整个集合以返回3个匹配的文档。该查询还必须扫描每个文档的整体,可能会将它们拉入内存。这导致昂贵且可能缓慢的查询操作。
当使用索引运行时,查询会扫描3个索引条目和3个文档以返回3个匹配的文档,因此查询效率很高。
Compare Performance of Indexes
To manually compare the performance of a query using more than one index, you can use the hint() method in conjunction with the explain() method.
Consider the following query:
db.inventory.find( {
   quantity: {
      $gte: 100, $lte: 300
   },
   type: "food"
} )
The query returns the following documents:
{ "_id" : 2, "item" : "f2", "type" : "food", "quantity" : 100 }
{ "_id" : 5, "item" : "f3", "type" : "food", "quantity" : 300 }
To support the query, add a compound index. With compound indexes, the order of the fields matter.
For example, add the following two compound indexes. The first index orders by quantity field first, and then the type field. The second index orders by type first, and then the quantity field.
db.inventory.createIndex( { quantity: 1, type: 1 } )
db.inventory.createIndex( { type: 1, quantity: 1 } )
Evaluate the effect of the first index on the query:
db.inventory.find(
   { quantity: { $gte: 100, $lte: 300 }, type: "food" }
).hint({ quantity: 1, type: 1 }).explain("executionStats")
The explain() method returns the following output:
{
   "queryPlanner" : {
      ...
      "winningPlan" : {
         "stage" : "FETCH",
         "inputStage" : {
            "stage" : "IXSCAN",
            "keyPattern" : {
               "quantity" : 1,
               "type" : 1
            },
            ...
            }
         }
      },
      "rejectedPlans" : [ ]
   },
   "executionStats" : {
      "executionSuccess" : true,
      "nReturned" : 2,
      "executionTimeMillis" : 0,
      "totalKeysExamined" : 5,
      "totalDocsExamined" : 2,
      "executionStages" : {
      ...
      }
   },
   ...
}
MongoDB scanned 5 index keys (executionStats.totalKeysExamined) to return 2 matching documents (executionStats.nReturned).
Evaluate the effect of the second index on the query:
db.inventory.find(
   { quantity: { $gte: 100, $lte: 300 }, type: "food" }
).hint({ type: 1, quantity: 1 }).explain("executionStats")
The explain() method returns the following output:
{
   "queryPlanner" : {
      ...
      "winningPlan" : {
         "stage" : "FETCH",
         "inputStage" : {
            "stage" : "IXSCAN",
            "keyPattern" : {
               "type" : 1,
               "quantity" : 1
            },
            ...
         }
      },
      "rejectedPlans" : [ ]
   },
   "executionStats" : {
      "executionSuccess" : true,
      "nReturned" : 2,
      "executionTimeMillis" : 0,
      "totalKeysExamined" : 2,
      "totalDocsExamined" : 2,
      "executionStages" : {
         ...
      }
   },
   ...
}
MongoDB scanned 2 index keys (executionStats.totalKeysExamined) to return 2 matching documents (executionStats.nReturned).
For this example query, the compound index { type: 1, quantity: 1 } is more efficient than the compound index { quantity: 1, type: 1 } .